

Responsive timeline
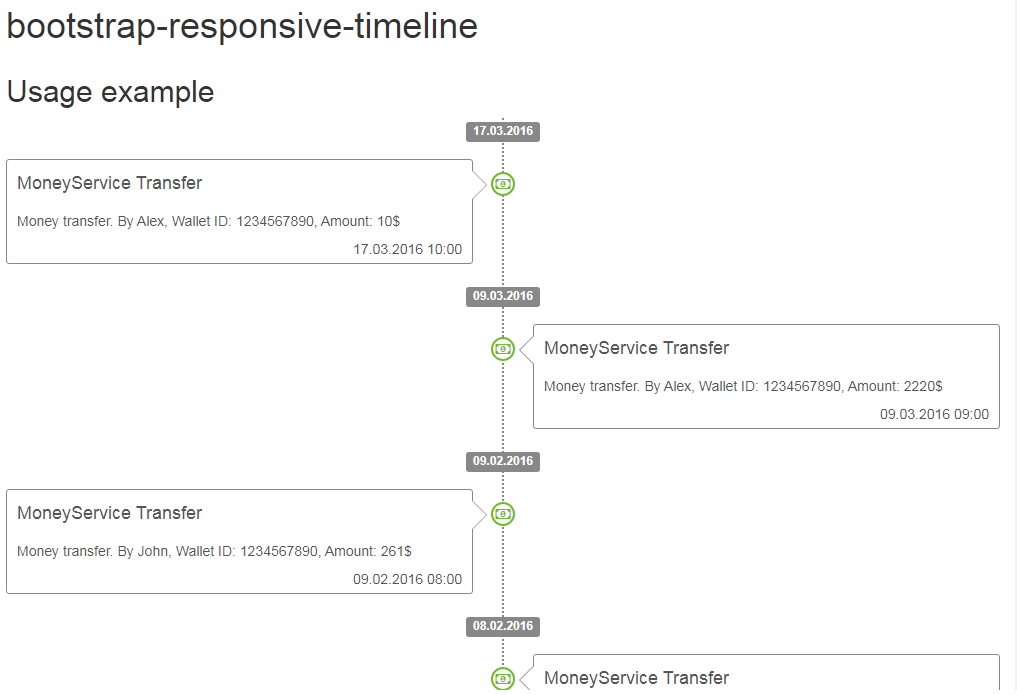
Responsive timeline
Responsive timeline using HTML and CSS
All resources on this site are contributed by netizens or reprinted by major download sites. Please check the integrity of the software yourself! All resources on this site are for learning reference only. Please do not use them for commercial purposes. Otherwise, you will be responsible for all consequences! If there is any infringement, please contact us to delete it. Contact information: admin@php.cn
Related Article
 How to make a timeline in Excel
17 Jul 2025
The key to making a timeline in Excel is to organize your data and select the right chart type. First, organize the data structure, including at least three columns: task name, start time and end time; second, insert the "cluster bar chart" as the timeline chart, and set the horizontal axis to date format to correctly display the time sequence; finally, beautify the chart by removing the legend, adjusting the colors, hiding grid lines, adding data labels, etc., and you can also insert shapes to connect the task to form a flow chart effect. In addition, you can quickly display time progress in a table using the "data stripes" in the conditional format, suitable for informal occasions.
 How to create a timeline with HTML and CSS?
15 Jul 2025
The key to creating a timeline with HTML and CSS is the clear structure and reasonable style. 1. Use or build a time point structure, each time point contains time tags and content; 2. Draw time axis lines and dot marks through pseudo-elements of CSS::before or ::after; 3. Use floating or margin to realize left and right interlacing of event content; 4. Add transition effects to improve the interactive experience, such as enlarging time points during hovering; 5. Pay attention to positioning, spacing and responsive processing to ensure the beautiful and adaptable layout. Mastering these key points allows you to flexibly build a timeline of multiple styles.
 How to Create a Timeline Filter in Excel
03 Apr 2025
In Excel, using the timeline filter can display data by time period more efficiently, which is more convenient than using the filter button. The Timeline is a dynamic filtering option that allows you to quickly display data for a single date, month, quarter, or year. Step 1: Convert data to pivot table First, convert the original Excel data into a pivot table. Select any cell in the data table (formatted or not) and click PivotTable on the Insert tab of the ribbon. Related: How to Create Pivot Tables in Microsoft Excel Don't be intimidated by the pivot table! We will teach you basic skills that you can master in minutes. Related Articles In the dialog box, make sure the entire data range is selected (
 How to get real-time time in vue
07 Apr 2025
How to get real-time time? In Vue, you can get real-time time by using JavaScript's Date object or built-in filter | date. Use Date object: const now = new Date(); Use | date filter: <template><p>{{ new Date() | date('yyyy-MM-dd HH:mm:ss') }}</p></template>&l
 What's the Most Efficient Way to Extract a Date from a DATETIME Value in SQL Server?
13 Jan 2025
Efficiently Extracting Date from Date Time in SQL ServerDetermining the most efficient technique to extract a date from a combined date and time...
 How Can PHP Simplify Date and Time Management Across Different Time Zones?
27 Dec 2024
Timezone Conversion in PHP: Simplifying Date and Time Management Across Time ZonesConverting date and time across time zones is a common challenge...
 How to Calculate Total Time from Date-Time Intervals in MySQL?
11 Nov 2024
Calculating Total Time from Date-Time Intervals in MySQLWhen working with date-time values, calculating time differences can be a common task. In...
 How to Calculate and Format Elapsed Time Since a Date in PHP?
16 Dec 2024
Finding Time Elapsed Since a Date Time in PHPDetermining the time elapsed since a specific date and time can be useful in various applications,...
 How Can I Easily Convert Date and Time Between Time Zones in PHP?
16 Dec 2024
Converting Date and Time across Time Zones in PHPConverting date and time between different time zones is a common task in PHP. Here's an...


Hot Tools

TikTok Roman clock effect
TikTok Roman clock effect
Simple js clock effect
Clock designed using html, css and javascript to display the current time.
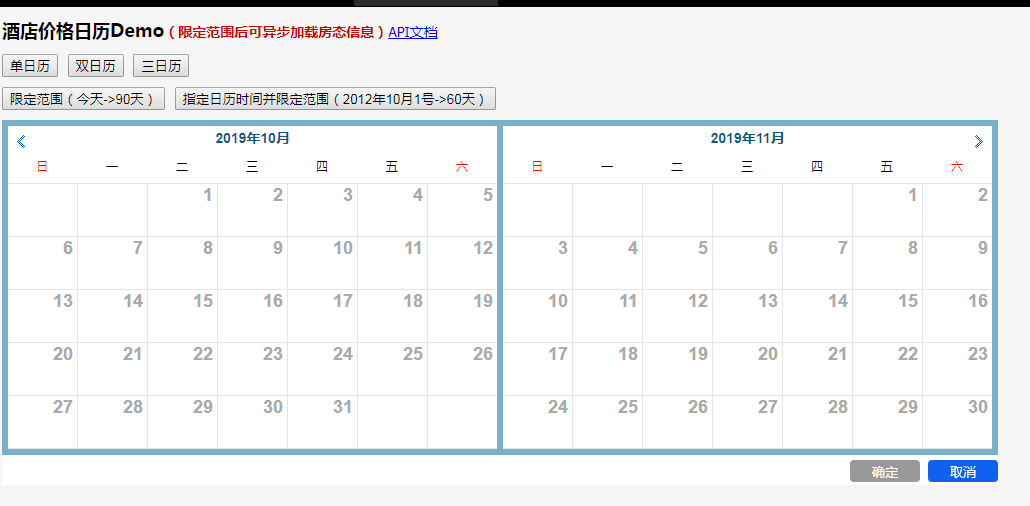
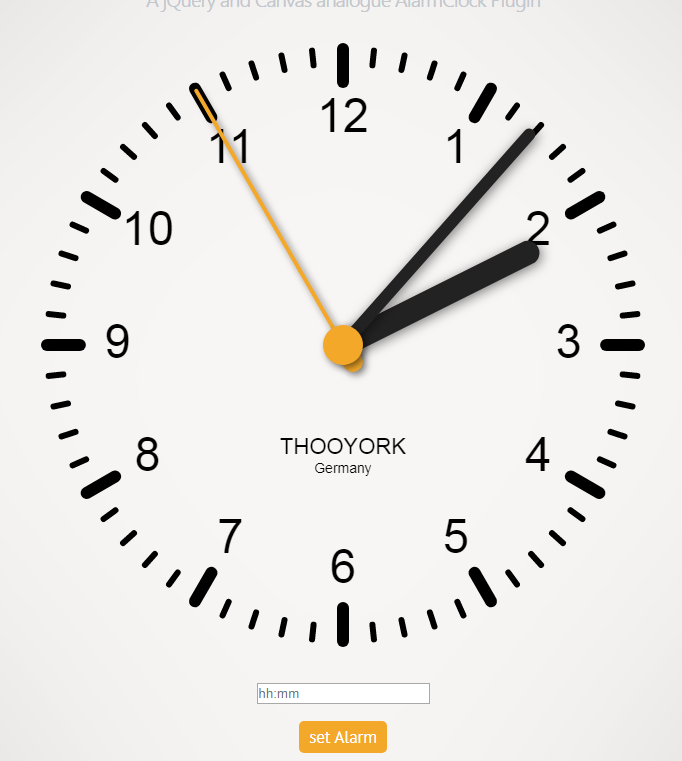
Price calendar plugin PriceCalendar
Price calendar plugin PriceCalendar

Technological digital clock vue special effects
clock, html5 clock, vue