
 Backend Development
Golang
Golang development: Use Prometheus to monitor application performance
Backend Development
Golang
Golang development: Use Prometheus to monitor application performance
Golang development: Use Prometheus to monitor application performance
Sep 21, 2023 pm 12:39 PM

Golang development: Use Prometheus to monitor application performance, specific code examples are required
Abstract: This article introduces how to use the Prometheus library in Golang development to monitor application performance, and Specific code examples are provided to facilitate developers to get started quickly.
Introduction:
In modern application development, monitoring application performance is a very important link. Through monitoring, we can understand the running status of the application in real time, discover problems in time and make adjustments, thereby improving the stability and performance of the application.
Prometheus is an open source monitoring system and time series database that is widely used in the monitoring field of cloud native and containerized applications. It provides a wealth of monitoring indicator types and functions, which can help us monitor application performance indicators in real time.
This article will use a specific example to demonstrate how to use the Prometheus library in Golang development for application performance monitoring.
Step 1: Install and configure Prometheus
First, we need to install and configure Prometheus in the system. Binaries can be downloaded from the official website (https://prometheus.io/) and installed.
After the installation is complete, you need to configure the Prometheus configuration file prometheus.yml. In the configuration file, we need to define the goals to be monitored and the corresponding metrics.
For example, if we want to monitor the total number of HTTP requests and request delay of a Golang application, we can add the following configuration:
scrape_configs:
  - job_name: 'my_app'
    metrics_path: /metrics
    static_configs:
    - targets: ['localhost:8080']
Step 2: Add Prometheus monitoring code in the Golang application
Next, we need to add Prometheus-related code to the Golang application. First, we need to introduce the Prometheus library:
import (
   "github.com/prometheus/client_golang/prometheus"
   "github.com/prometheus/client_golang/prometheus/promhttp"
)
Then, we can define the indicators that need to be monitored. In our example, we define an indicator for counting the total number of requests and an indicator for counting request delays:
var (
   requestsTotal = prometheus.NewCounterVec(
      prometheus.CounterOpts{
         Name: "http_requests_total",
         Help: "Total number of HTTP requests.",
      },
      []string{"handler", "method"},
   )
   requestDuration = prometheus.NewHistogramVec(
      prometheus.HistogramOpts{
         Name: "http_request_duration_seconds",
         Help: "HTTP request duration in seconds.",
         Buckets: []float64{0.1, 0.2, 0.5, 1, 2, 5},
      },
      []string{"handler", "method"},
   )
)
Next, we need to add corresponding monitoring in the application's processing function code. At the beginning and end of each processing function, we can use the monitoring methods provided by Prometheus to collect and record data.
For example, the following code demonstrates how to use Prometheus to monitor HTTP requests in Golang applications:
func handleHello(w http.ResponseWriter, r *http.Request) {
   start := time.Now()

   // 執(zhí)行實際的處理邏輯

   elapsedTime := time.Since(start).Seconds()
   requestsTotal.WithLabelValues("/hello", r.Method).Inc()
   requestDuration.WithLabelValues("/hello", r.Method).Observe(elapsedTime)
}
Finally, we need to set up Prometheus's HTTP processor so that Prometheus can pass HTTP The interface obtains the indicators we defined.
func main() {
   http.Handle("/metrics", promhttp.Handler())
   http.HandleFunc("/hello", handleHello)
   http.ListenAndServe(":8080", nil)
}
Step 3: Start the application and access the Prometheus monitoring interface
After completing the above steps, we can start our application and access the Prometheus monitoring interface. Enter http://localhost:9090 in the browser, and then enter the indicator name we defined in the query box to view the corresponding performance indicator data.
For example, we can check the total number of requests by querying http_requests_total, and check the request delay by querying http_request_duration_seconds.
Summary:
This article introduces how to use the Prometheus library in Golang development to monitor application performance, and provides specific code examples. Through Prometheus, we can easily collect and record various indicators of the application, and view and analyze them in real time through the Prometheus monitoring interface.
Although this article only introduces basic usage and examples, Prometheus provides richer functions and scalability to meet the monitoring requirements of different scenarios and needs. I hope this article can help readers who are interested in Prometheus and inspire more exploration and practice.
The above is the detailed content of Golang development: Use Prometheus to monitor application performance. For more information, please follow other related articles on the PHP Chinese website!

Hot AI Tools

Undress AI Tool
Undress images for free

Undresser.AI Undress
AI-powered app for creating realistic nude photos

AI Clothes Remover
Online AI tool for removing clothes from photos.

Clothoff.io
AI clothes remover

Video Face Swap
Swap faces in any video effortlessly with our completely free AI face swap tool!

Hot Article
Hot Tools

Notepad++7.3.1
Easy-to-use and free code editor

SublimeText3 Chinese version
Chinese version, very easy to use

Zend Studio 13.0.1
Powerful PHP integrated development environment

Dreamweaver CS6
Visual web development tools

SublimeText3 Mac version
God-level code editing software (SublimeText3)
Hot Topics


 How to safely read and write files using Golang?
Jun 06, 2024 pm 05:14 PM
How to safely read and write files using Golang?
Jun 06, 2024 pm 05:14 PM
Reading and writing files safely in Go is crucial. Guidelines include: Checking file permissions Closing files using defer Validating file paths Using context timeouts Following these guidelines ensures the security of your data and the robustness of your application.
 Golang and C : Concurrency vs. Raw Speed
Apr 21, 2025 am 12:16 AM
Golang and C : Concurrency vs. Raw Speed
Apr 21, 2025 am 12:16 AM
Golang is better than C in concurrency, while C is better than Golang in raw speed. 1) Golang achieves efficient concurrency through goroutine and channel, which is suitable for handling a large number of concurrent tasks. 2)C Through compiler optimization and standard library, it provides high performance close to hardware, suitable for applications that require extreme optimization.
 Golang vs. C : Performance and Speed Comparison
Apr 21, 2025 am 12:13 AM
Golang vs. C : Performance and Speed Comparison
Apr 21, 2025 am 12:13 AM
Golang is suitable for rapid development and concurrent scenarios, and C is suitable for scenarios where extreme performance and low-level control are required. 1) Golang improves performance through garbage collection and concurrency mechanisms, and is suitable for high-concurrency Web service development. 2) C achieves the ultimate performance through manual memory management and compiler optimization, and is suitable for embedded system development.
 Transforming from front-end to back-end development, is it more promising to learn Java or Golang?
Apr 02, 2025 am 09:12 AM
Transforming from front-end to back-end development, is it more promising to learn Java or Golang?
Apr 02, 2025 am 09:12 AM
Backend learning path: The exploration journey from front-end to back-end As a back-end beginner who transforms from front-end development, you already have the foundation of nodejs,...
 Which libraries in Go are developed by large companies or provided by well-known open source projects?
Apr 02, 2025 pm 04:12 PM
Which libraries in Go are developed by large companies or provided by well-known open source projects?
Apr 02, 2025 pm 04:12 PM
Which libraries in Go are developed by large companies or well-known open source projects? When programming in Go, developers often encounter some common needs, ...
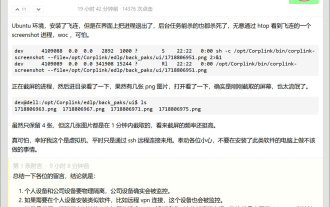 Byte Feilian accused of monitoring screenshots? Relevant person: It is the enterprise that has turned on the data leakage prevention function
Jun 21, 2024 pm 09:47 PM
Byte Feilian accused of monitoring screenshots? Relevant person: It is the enterprise that has turned on the data leakage prevention function
Jun 21, 2024 pm 09:47 PM
According to news on the afternoon of June 21, recently, some netizens said that after installing FeiLian (FeiLian is an office platform used internally by ByteDance and open to the public), they accidentally discovered that FeiLian was executing a screenshot process in the background. The user It reminds everyone not to do things you shouldn't do on computers with such software installed. Sina Technology asked ByteDance about this, and relevant sources said that Feilian provides data security protection functions for corporate customers. Enterprises can set the functional configuration of automated audit policies based on their own business needs and data sensitivity. The situation described in the forum post is that the enterprise administrator has enabled the DLP (data leakage prevention) function on the device that stores sensitive data. Felian will cycle through sensitive devices with DLP enabled at certain intervals.
 Golang vs. Python: Performance and Scalability
Apr 19, 2025 am 12:18 AM
Golang vs. Python: Performance and Scalability
Apr 19, 2025 am 12:18 AM
Golang is better than Python in terms of performance and scalability. 1) Golang's compilation-type characteristics and efficient concurrency model make it perform well in high concurrency scenarios. 2) Python, as an interpreted language, executes slowly, but can optimize performance through tools such as Cython.
 Golang's Purpose: Building Efficient and Scalable Systems
Apr 09, 2025 pm 05:17 PM
Golang's Purpose: Building Efficient and Scalable Systems
Apr 09, 2025 pm 05:17 PM
Go language performs well in building efficient and scalable systems. Its advantages include: 1. High performance: compiled into machine code, fast running speed; 2. Concurrent programming: simplify multitasking through goroutines and channels; 3. Simplicity: concise syntax, reducing learning and maintenance costs; 4. Cross-platform: supports cross-platform compilation, easy deployment.
