


Introduction
Statistical Process Control (SPC) charts are essential tools in quality management, enabling organizations to monitor, control, and improve their processes. By applying statistical methods, SPC charts visually represent data variations and patterns, ensuring consistent product quality. This guide explores various SPC chart types, their functionalities, and practical applications.

Key Takeaways
This guide will cover: the fundamentals of SPC charts; different SPC chart types; the advantages of using SPC charts in quality management; effective implementation strategies; and creating SPC charts using Python and Excel.
Table of contents
- What are SPC Charts?
- Types of SPC Charts
- Advantages of Using SPC Charts
- Effective Implementation of SPC Charts
- Python Example: Creating an SPC Chart
- Excel Example: Creating an SPC Chart
- Frequently Asked Questions
What are SPC Charts?
SPC charts, also known as control charts, graphically display data points over time. They differentiate between common-cause variation (inherent to the process) and special-cause variation (unusual or assignable causes). This distinction is crucial for maintaining process stability and identifying areas for improvement.
Types of SPC Charts
Several SPC chart types cater to different data and process characteristics. Key types include:
- X-bar and R Chart: Monitors the process mean (X-bar) and range (R) within subgroups. The X-bar chart tracks average subgroup values, while the R chart tracks the range within each subgroup.
- P-Chart: Tracks the proportion of defective items within a sample. Suitable for categorical data where each item is either defective or non-defective.
- C-Chart: Counts the number of defects in a single unit of product. Ideal for processes where the number of defects per unit is counted.
- U-Chart: Similar to the C-chart, but accounts for varying sample sizes. Monitors defects per unit, offering greater sample size flexibility.
Advantages of Using SPC Charts
Implementing SPC charts offers numerous benefits:
- Enhanced Quality Control: Provides ongoing process monitoring and control, ensuring consistent product quality.
- Early Problem Detection: Enables timely identification of process deviations, facilitating prompt corrective actions.
- Data-Driven Decision Making: Offers a visual representation of process data, supporting informed decisions based on real-time insights.
Effective Implementation of SPC Charts
Successful SPC chart implementation involves these steps:
- Chart Selection: Choose the appropriate chart type based on data and process characteristics.
- Data Collection: Systematically gather accurate and consistent data points.
- Control Limit Calculation: Determine upper and lower control limits based on historical data, defining acceptable variation.
- Data Plotting: Plot data points on the chart, highlighting points outside the control limits.
- Analysis and Action: Analyze the chart for trends or unusual variations. Implement corrective actions for out-of-control points.
Python Example: Creating an SPC Chart
Here's how to create an X-bar and R chart using Python:
import numpy as np
import matplotlib.pyplot as plt

# Sample data
data = np.array([[5, 6, 7], [8, 9, 7], [5, 6, 7], [8, 9, 6], [5, 6, 8]])

# Calculate subgroup means and ranges
x_bar = np.mean(data, axis=1)
R = np.ptp(data, axis=1)

# Calculate overall mean and average range
x_double_bar = np.mean(x_bar)
R_bar = np.mean(R)

# Control limits for X-bar chart
A2 = 0.577  # Factor for X-bar chart control limits
UCL_x_bar = x_double_bar   A2 * R_bar
LCL_x_bar = x_double_bar - A2 * R_bar

# Control limits for R chart
D4 = 2.114  # Factor for R chart upper control limit
D3 = 0    # Factor for R chart lower control limit
UCL_R = D4 * R_bar
LCL_R = D3 * R_bar

# Plot X-bar chart
plt.figure(figsize=(12, 6))
plt.subplot(211)
plt.plot(x_bar, marker='o', linestyle='-', color='b')
plt.axhline(y=x_double_bar, color='g', linestyle='-')
plt.axhline(y=UCL_x_bar, color='r', linestyle='--')
plt.axhline(y=LCL_x_bar, color='r', linestyle='--')
plt.title('X-Bar Chart')
plt.xlabel('Subgroup')
plt.ylabel('Mean')

# Plot R chart
plt.subplot(212)
plt.plot(R, marker='o', linestyle='-', color='b')
plt.axhline(y=R_bar, color='g', linestyle='-')
plt.axhline(y=UCL_R, color='r', linestyle='--')
plt.axhline(y=LCL_R, color='r', linestyle='--')
plt.title('R Chart')
plt.xlabel('Subgroup')
plt.ylabel('Range')
plt.tight_layout()
plt.show()

Code Explanation
This Python script generates X-bar and R charts using sample data, illustrating how these charts track process stability over time. It utilizes NumPy for numerical computations and Matplotlib for visualization.
Excel Example: Creating an SPC Chart
Creating an SPC chart in Excel involves these steps:
- Data Input: Enter your data into an Excel spreadsheet, organizing subgroups in rows and observations in columns.
- Calculations: Use Excel functions (AVERAGE, MAX, MIN) to calculate subgroup averages and ranges.
- Control Limit Determination: Calculate the overall average and average range. Apply appropriate constants (A2, D3, D4) to compute control limits.
- Chart Creation: Select the data and insert a line chart. Add horizontal lines for control limits using Excel's charting features.
Conclusion
Understanding and applying SPC charts is vital for organizations seeking to enhance quality control, improve process efficiency, and achieve superior product quality. SPC charts provide a structured approach to process monitoring and refinement, serving as invaluable tools in quality management.
Frequently Asked Questions
Q1. Applicability of SPC charts in service industries? Yes, SPC charts are applicable in service industries to monitor and improve service quality aspects such as response times, customer satisfaction, and error rates.
Q2. Meaning of control limits? Control limits represent the acceptable range of variation in a process. Data points outside these limits signal potential process issues.
Q3. Role of SPC charts in regulatory compliance? SPC charts help maintain consistent quality, provide evidence of process control, and support documentation requirements for regulatory compliance.
The above is the detailed content of What is SPC Charts? - Analytics Vidhya. For more information, please follow other related articles on the PHP Chinese website!

Hot AI Tools

Undress AI Tool
Undress images for free

Undresser.AI Undress
AI-powered app for creating realistic nude photos

AI Clothes Remover
Online AI tool for removing clothes from photos.

Clothoff.io
AI clothes remover

Video Face Swap
Swap faces in any video effortlessly with our completely free AI face swap tool!

Hot Article
Hot Tools

Notepad++7.3.1
Easy-to-use and free code editor

SublimeText3 Chinese version
Chinese version, very easy to use

Zend Studio 13.0.1
Powerful PHP integrated development environment

Dreamweaver CS6
Visual web development tools

SublimeText3 Mac version
God-level code editing software (SublimeText3)


 Kimi K2: The Most Powerful Open-Source Agentic Model
Jul 12, 2025 am 09:16 AM
Kimi K2: The Most Powerful Open-Source Agentic Model
Jul 12, 2025 am 09:16 AM
Remember the flood of open-source Chinese models that disrupted the GenAI industry earlier this year? While DeepSeek took most of the headlines, Kimi K1.5 was one of the prominent names in the list. And the model was quite cool.
 Grok 4 vs Claude 4: Which is Better?
Jul 12, 2025 am 09:37 AM
Grok 4 vs Claude 4: Which is Better?
Jul 12, 2025 am 09:37 AM
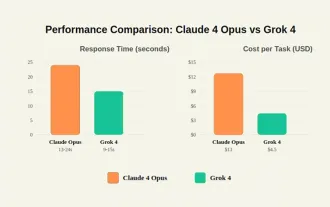
By mid-2025, the AI “arms race” is heating up, and xAI and Anthropic have both released their flagship models, Grok 4 and Claude 4. These two models are at opposite ends of the design philosophy and deployment platform, yet they
 10 Amazing Humanoid Robots Already Walking Among Us Today
Jul 16, 2025 am 11:12 AM
10 Amazing Humanoid Robots Already Walking Among Us Today
Jul 16, 2025 am 11:12 AM
But we probably won’t have to wait even 10 years to see one. In fact, what could be considered the first wave of truly useful, human-like machines is already here. Recent years have seen a number of prototypes and production models stepping out of t
 Context Engineering is the 'New' Prompt Engineering
Jul 12, 2025 am 09:33 AM
Context Engineering is the 'New' Prompt Engineering
Jul 12, 2025 am 09:33 AM
Until the previous year, prompt engineering was regarded a crucial skill for interacting with large language models (LLMs). Recently, however, LLMs have significantly advanced in their reasoning and comprehension abilities. Naturally, our expectation
 What Are The 7 Types Of AI Agents?
Jul 11, 2025 am 11:08 AM
What Are The 7 Types Of AI Agents?
Jul 11, 2025 am 11:08 AM
Picture something sophisticated, such as an AI engine ready to give detailed feedback on a new clothing collection from Milan, or automatic market analysis for a business operating worldwide, or intelligent systems managing a large vehicle fleet.The
 Concealed Command Crisis: Researchers Game AI To Get Published
Jul 13, 2025 am 11:08 AM
Concealed Command Crisis: Researchers Game AI To Get Published
Jul 13, 2025 am 11:08 AM
Scientists have uncovered a clever yet alarming method to bypass the system. July 2025 marked the discovery of an elaborate strategy where researchers inserted invisible instructions into their academic submissions — these covert directives were tail
 United Nations Considering These Four Crucial Actions To Save The World From Dire AGI And Killer AI Superintelligence
Jul 13, 2025 am 11:09 AM
United Nations Considering These Four Crucial Actions To Save The World From Dire AGI And Killer AI Superintelligence
Jul 13, 2025 am 11:09 AM
Be aware that the United Nations has had an ongoing interest in how AI is advancing and what kinds of international multilateral arrangements and collaborations ought to be taking place (see my coverage at the link here). The distinctive element of t
 Grok 4 is Here and it's Simply Brilliant! - Analytics Vidhya
Jul 12, 2025 am 09:14 AM
Grok 4 is Here and it's Simply Brilliant! - Analytics Vidhya
Jul 12, 2025 am 09:14 AM
“It’s smarter than almost all graduate students in all disciplines – Elon Musk.” Elon Musk and his Grok team are back with their latest and best model to date: Grok 4. It was only 3 months ago that this team of e
